Indiana General Election Voter Patterns
I wanted to give you just some basic voting data for Indiana leading into the 2024 General Election. I focused on general elections in presidential years only. I compiled data for 2012, 2016, and 2020.
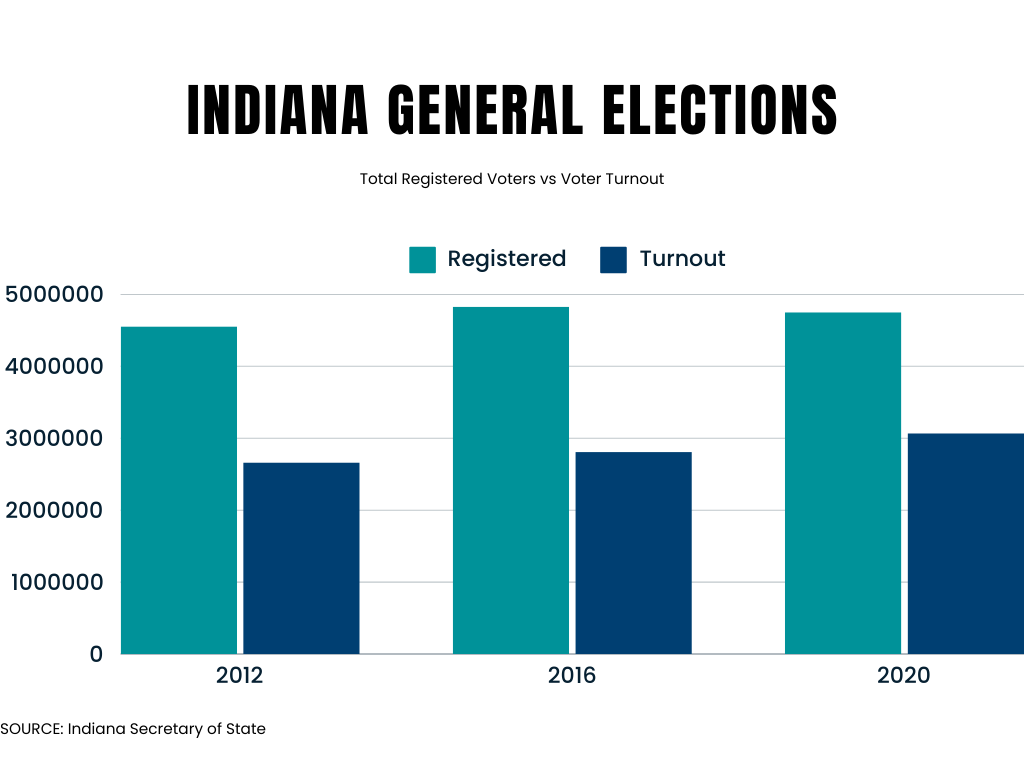
First, let’s take a look at total registered voters vs actual voter turnout over the past three presidential election cycles.

This is, actually, the most interesting set of data, in my opinion.
In 2012, the population of the Hoosier state was around 6,538,989 people. In 2020, the population was around 6,789,098 people. That’s a population increase of 3.82%. Yet, the number of registered voters increased by 4.31% between 2012 and 2020 with a decrease of 1.61% between 2016 and 2020. There has been a prolonged battle to cure Indiana’s voter rolls by purging registered voters who are no longer legal voters for various reasons.
There have been various attempts to smear Indiana’s attempts to ensure registered voters are, actually, legal voters. The media reported that between 2012 and 2014, Indiana removed 22.4% of its voting population. Yet, the number of registered voters from 2012 to 2016 increased over 6%. For the years in question, where Indiana allegedly removed over 22% of voters, the number of registered voters actually increased 0.83%. Indiana’s attempts to ensure voting integrity have been fought every step of the way by activists.
In 2020, the Center For Public Integrity alleged that “Indiana has made it harder for people to vote.” Well, if that’s the case, why are more people voting? Turnout has continually increased for the main elections. No, looking at primaries and municipal elections where there’s general apathy doesn’t count.
Now onto how voters vote …

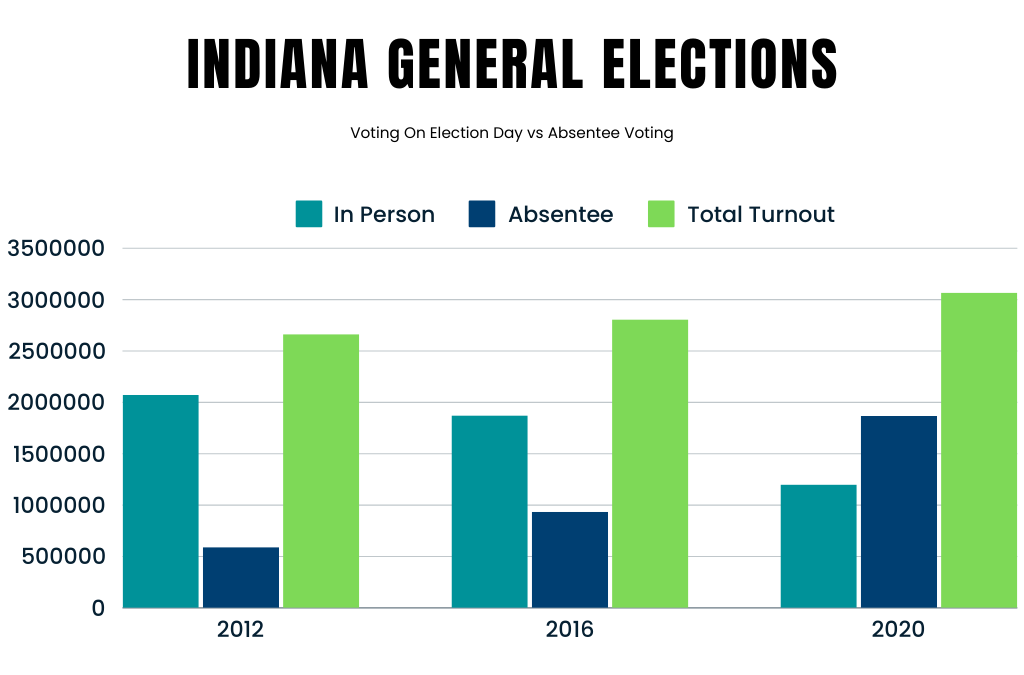
As you can see in the chart, since 2012, total voter turnout for presidential year general elections have increased. Hard to do in a state where the liberal activists say Indiana is making it “harder for people to vote.”
Another statistic we see is the ever-decreasing number of people who vote in person and the increasing number who vote absentee. We had COVID in 2020 but the numbers were moving away from voting in person to absentee long before COVID.
The numbers are somewhat staggering.
Absentee voting from 2012 to 2020 increased by over 216%. While in-person voting decreased by over 42%.
In 2014, Pew Research showed Republicans with a 5-point advantage over Democrats in Indiana.
In 2017, Gallop gave Republicans just a 2-point advantage.
Since 2012, Republican presidential candidates have received higher percentages of votes than Democrats. Part of that could be the Mike Pence factor as the Vice Presidential candidate.
Indiana doesn’t register voters by party affiliation so getting unbiased numbers is difficult. So trends in that regard are hard to see.
More people are moving to Indiana than away from it. Many are from blue states. Republicans would like you to believe they are mostly Republicans fleeing Democrat policies, but Indiana doesn’t have a reputation as a refuge for conservatives. Texas and Florida do, but Indiana does not.
2024 will be an interesting year to evaluate for years to come. The unique circumstances surrounding Trump/Biden 2.0 could provide for temporary anomalies in election patterns or could completely reset the electorate in a way previously unimaginable.


